Top 10 Best Server Monitoring Tools in 2025

Server monitoring tools are essential for maintaining the health and performance of IT infrastructure. These tools provide real-time insights into server metrics such as CPU usage, memory, disk space, and network performance.
Popular options include Zabbix, known for its scalability and flexibility, and Nagios, which offers extensive plugin support for customizable monitoring. LibreNMS is another open-source tool that supports a wide range of hardware and operating systems, making it suitable for diverse IT environments.
Checkmk is recognized for its ultra-scalability and ease of setup, allowing it to monitor thousands of servers with minimal configuration. Grafana is often used for data visualization, integrating with various data sources to create real-time dashboards.

PRTG Network Monitor offers a comprehensive monitoring solution with customizable alerts and flexible dashboards. These tools help IT teams identify and resolve issues promptly, ensuring server uptime and optimal performance.
They also support various operating systems and can scale according to business needs. Whether you’re managing small or large-scale infrastructure, these tools provide the necessary insights to maintain peak server performance.
Here Are Our Picks For The Best Server Monitoring Tools And Their Feature
- Zabbix: Offers real-time monitoring, alerting, and visualization for network devices, servers, and applications.
- Prometheus: Open-source system monitoring with a powerful query language and built-in alerting.
- Nagios: Provides comprehensive monitoring and alerting for servers, switches, applications, and services.
- SolarWinds Server & Application Monitor: Tracks performance and availability of servers and applications.
- Datadog: Cloud-based monitoring with real-time observability for infrastructure, applications, and logs.
- PRTG Network Monitor: Monitors network performance, devices, bandwidth, and server health.
- New Relic: Provides detailed performance monitoring and diagnostics for applications and infrastructure.
- Dynatrace: AI-powered monitoring for applications, infrastructure, and user experience.
- ManageEngine: Unified monitoring for servers, networks, applications, and cloud services.
- Cacti: All-in-one network monitoring solution for bandwidth, uptime, and performance.
| 10 Server Monitoring Tools | Features | Stand Alone Feature | Free Trial / Demo |
|---|---|---|---|
| 1. Zabbix | 1 Web tracking 2. Monitoring with SNMP 3. Application tracking 4. Dashboards that can be customized | Unified monitoring for networks, servers, and applications. | Yes |
| 2. Prometheus | 1. Collection of time series data 2. Scraping and storing metrics 3. Metrics scraping and storage 4. System of alerts and notifications | Time-series data collection with powerful querying. | No |
| 3. Nagios | 1. Monitoring 2. Alerting 3. Event management 4. Performance visualization | Extensive plugin support for various monitoring needs. | No |
| 4. SolarWinds Server & Application Monitor | 1. Application performance monitoring (APM) 2. Infrastructure Surveillance 3. Analytics and reporting in real time 4. EUM stands for end-user monitoring. | Comprehensive application performance management. | Yes |
| 5. Datadog | 1. Infrastructure Monitoring 2. Application Performance Monitoring (APM) 3. Log Management 4. Real User Monitoring (RUM) 5. Network Performance Monitoring | Real-time monitoring with advanced analytics. | Yes |
| 6. PRTG Network Monitor | 1. Server and application monitoring 2. Monitoring performance in real-time 3. Real-time performance monitoring 4. Reporting and dashboards | Versatile, customizable sensors for all devices. | Yes |
| 7. New Relic | 1. Application performance monitoring (APM) 2. Infrastructure Surveillance 3. Analytics and reporting in real-time 4. EUM stands for end-user monitoring. | Full-stack observability for applications and infrastructure. | Yes |
| 8. Dynatrace | 1. User monitoring in real time 2. User experience tracking 3. Browser tracking 4. Performance metrics tracking | AI-driven automated root cause analysis. | Yes |
| 9. ManageEngine | 1. Endpoint administration 2. Patch administration 3. Management of mobile devices 4. Remote access and control | Integrated monitoring and IT management solution. | Yes |
| 10.Cacti | 1. Custom sensor design 2. Virtualization tracking 3. Database surveillance 4. Connection to other systems and tools | All-in-one monitoring with an intuitive interface. | Yes |
1. Zabbix
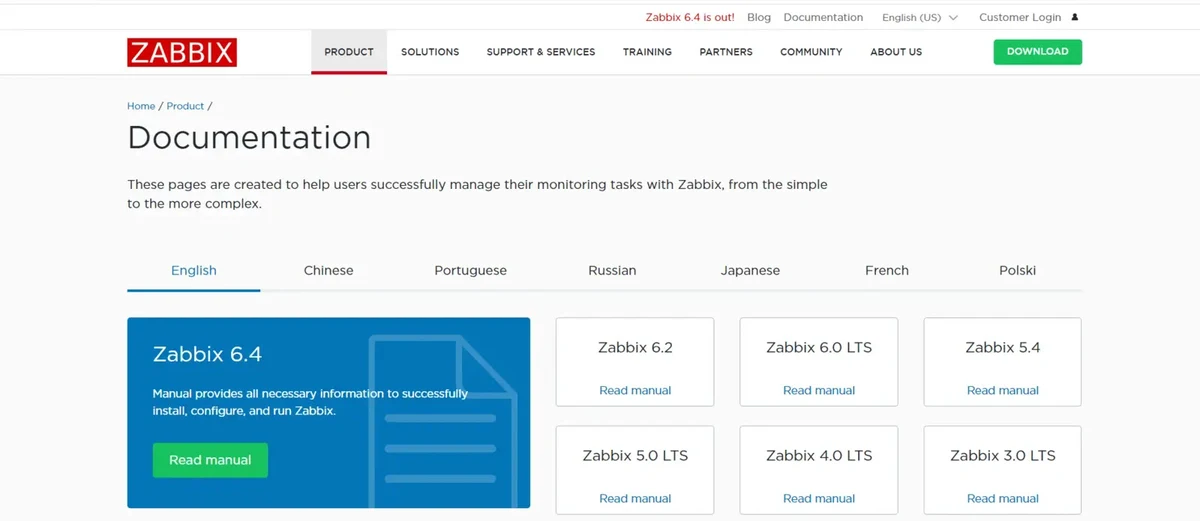
Zabbix is an open-source server monitoring tool that provides comprehensive monitoring and analytics for various network services, servers, and hardware, ensuring proactive issue detection and resolution.
It offers robust features such as real-time monitoring, alerting, and visualization, enabling administrators to maintain high availability and performance of their IT infrastructure through detailed metrics and trends.
Zabbix supports a wide range of platforms and is highly customizable. It allows integration with numerous third-party solutions and the ability to scale from small environments to large enterprise networks.
Pros and Cons
| Pros | Cons |
|---|---|
| 1. Proven and established | 1. Configuration complexity: |
| 2. Customizable and extensible: | 2. User interface: |
| 3. Flexibility | 3. Scalability challenges: |
| 4. Alerting and notifications: | 4. Lack of advanced features |
2. Prometheus

Prometheus is a free and open-source monitoring and alerting toolkit for collecting and analyzing time series data. It uses a pull-based architecture to periodically retrieve metric data from targets over HTTP or other supported protocols.
The Prometheus server is the system’s heart, collecting, storing, and analyzing metric data. Users may obtain and alter metrics data for analysis and visualization using Prometheus’ strong query language, PromQL.
Prometheus also provides alerting based on specified rules. Prometheus provides a reliable and adaptable monitoring solution for contemporary distributed systems and microservices architectures.
Pros and Cons
| Pros | Cons |
|---|---|
| 1. Powerful monitoring and alerting | 1. Storage limitations |
| 2. Scalability | 2. Complexity for large-scale setups |
| 3. Flexibility and extensibility | 3. Lack of native high availability: |
| 4. Pull-based model | 4. Resource requirements: |
3. Nagios
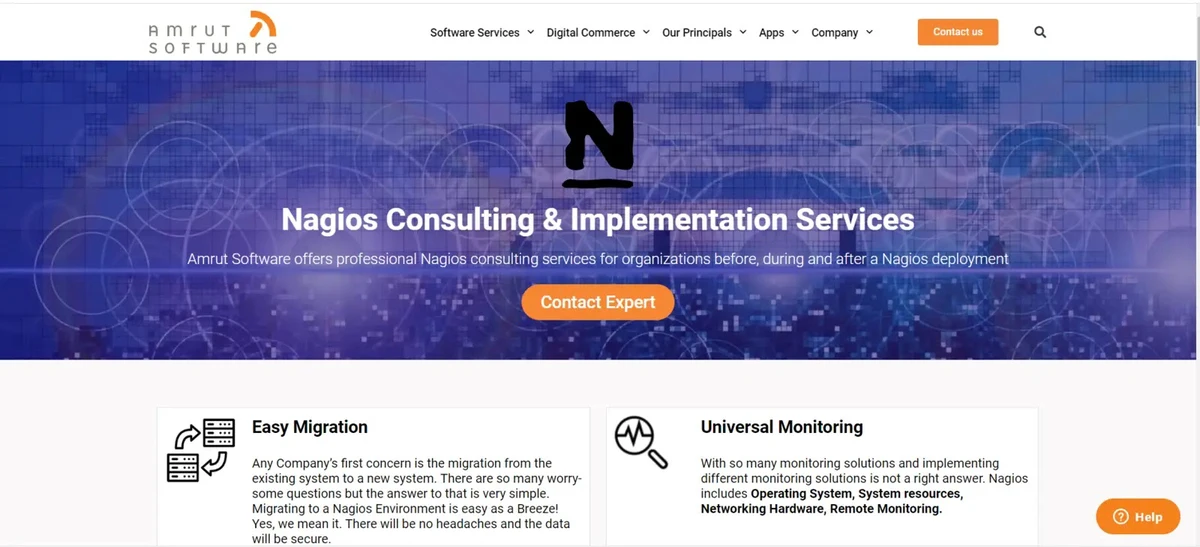
Nagios is an open-source server monitoring tool that comprehensively monitors network services, host resources, and network infrastructure, ensuring high availability and performance of critical IT systems.
It offers real-time monitoring, alerting, and reporting capabilities, allowing administrators to detect and resolve issues quickly, minimizing downtime, and ensuring business continuity.
Nagios is highly customizable and scalable, supporting many plugins and integrations. This makes it suitable for diverse environments and complex monitoring requirements.
Pros and Cons
| Pros | Cons |
|---|---|
| 1. Proven and established | 1. Configuration complexity |
| 2. Customizable and extensible: | 2. User interface |
| 3. Flexibility | 3. User interface |
| 4. Alerting and notifications | 4. Lack of advanced features |
4. SolarWinds Server & Application Monitor
SolarWinds Server & Application Monitor (SAM) is an all-in-one monitoring solution for complex IT systems that gives insights into the performance and availability of servers, apps, and infrastructure.
Its agentless architecture employs industry-standard protocols, including SNMP, WMI, and PowerShell, to collect data from servers and applications. SAM provides real-time monitoring, displaying performance metrics and status in intuitive dashboards, graphs, and charts.
It also enables capacity planning by analyzing historical data trends and providing predictive insights. SAM supports automation and remediation by integrating with other SolarWinds tools, allowing administrators to execute scripts or perform actions to resolve issues remotely.
Pros and Cons
| Pros | Cons |
|---|---|
| 1. Comprehensive monitoring | 1. Cost |
| 2. Ease of use | 2. Complexity for advanced configurations |
| 3. Scalability | 3. Resource requirements |
| 4. Alerting and notifications | 4. Limited customization |
5. Datadog

Datadog is a powerful server monitoring tool designed to provide comprehensive visibility into the performance and health of servers and applications.
It works by deploying agents on servers, collecting a wide range of metrics, storing and processing the data in a distributed backend infrastructure, and providing a centralized web interface for visualizing and analyzing the metrics, setting up alerts, and leveraging advanced monitoring capabilities.
With its intuitive interface and extensive visualization options, Datadog enables users to create customizable dashboards, set up automated alerts, and collaborate effectively across teams, enhancing visibility and operational efficiency across the entire IT environment.
Pros and Cons
| Pros | Cons |
|---|---|
| 1. Comprehensive monitoring | 1. Cost |
| 2. Real-time visibility | 2. Learning curve |
| 3. AIOps and machine learning: | 3. Limited log management features |
| 4. Customizable dashboards and visualizations | 4. Resource consumption |
6. PRTG Network Monitor
PRTG Network Monitor is an all-in-one network monitoring solution that gives you insight and control over your network’s infrastructure, devices, and applications.
It collects real-time performance data and metrics using monitoring technologies such as SNMP, WMI, NetFlow, and packet sniffing.
It provides a variety of predefined sensors for monitoring various characteristics of network devices and applications, such as bandwidth use, CPU and memory utilization, reaction times, and service availability.
PRTG’s scalability enables administrators to monitor small to extensive networks and offers remote monitoring, allowing them to monitor scattered settings.
Pros and Cons
| Pros | Cons |
|---|---|
| 1. Ease of use | 1. Cost |
| 2. Scalability | 2. Steep learning curve |
| 3. Comprehensive monitoring capabilities | 3. Resource-intensive |
| 4. Customization and flexibility: | 4. Customization limitations |
7. New Relic
New Relic Server Monitoring is a real-time tool designed to monitor server performance and health. It uses a lightweight agent on each server to collect metrics such as CPU usage, memory utilization, disk I/O, network traffic, and process activity.
It also provides alerting capabilities, historical data storage and analysis, trend analysis, capacity planning, and troubleshooting of server-related issues.
It simplifies the monitoring and management of server infrastructure, ensuring optimal performance and minimizing downtime.
Pros and Cons
| Pros | Cons |
|---|---|
| 1. Comprehensive monitoring | 1. Cost |
| 2. Application-centric focus | 2. Complexity for Beginners |
| 3. Easy to use | 3. Limited Data Retention |
| 4. integration and ecosystem | 4. Integration Challenges |
8. Dynatrace
Dynatrace provides full-stack monitoring with automatic discovery and mapping of all dependencies, ensuring comprehensive visibility across complex cloud environments and delivering real-time insights for proactive issue resolution.
The platform leverages AI-driven analytics to detect anomalies, identify root causes, and provide actionable insights, helping IT teams resolve performance issues quickly and maintain optimal application performance.
Dynatrace integrates seamlessly with a wide range of technologies and platforms, offering flexible deployment options and supporting continuous delivery pipelines to enhance the efficiency and reliability of software development and operations.
Pros and Cons
| Pros | Cons |
|---|---|
| 1. Deep Application Visibility | 1. Cost |
| 2. Automatic Discovery and Dependency Mapping | 2. Learning Curve |
| 3. AI-Powered Root Cause Analysis | 3. Complexity of Configuration |
| 4. Scalability and Cloud Native Support | 4. Dependency on Agent Deployment |
9. ManageEngine
The ManageEngine server monitoring tool is a comprehensive solution for monitoring the performance and availability of servers in IT infrastructures.
It operates by deploying agents on the servers to collect real-time data and metrics related to CPU usage, memory utilization, disk performance, network traffic, and more. The tool simplifies setup by providing pre-configured monitoring templates for various server platforms and applications.
With its user-friendly interface and extensive features, ManageEngine server monitoring solutions simplify server management, improve performance, and ensure the availability of your critical server infrastructure.
Pros and Cons
| Pros | Cons |
|---|---|
| 1. Comprehensive Suite of Tools | 1. Complexity for advanced configurations |
| 2. User-friendly interface: | 2. Limited customization options |
| 3. Integration capabilities | 3. Support limitations |
| 4. Scalability |
10. Cacti
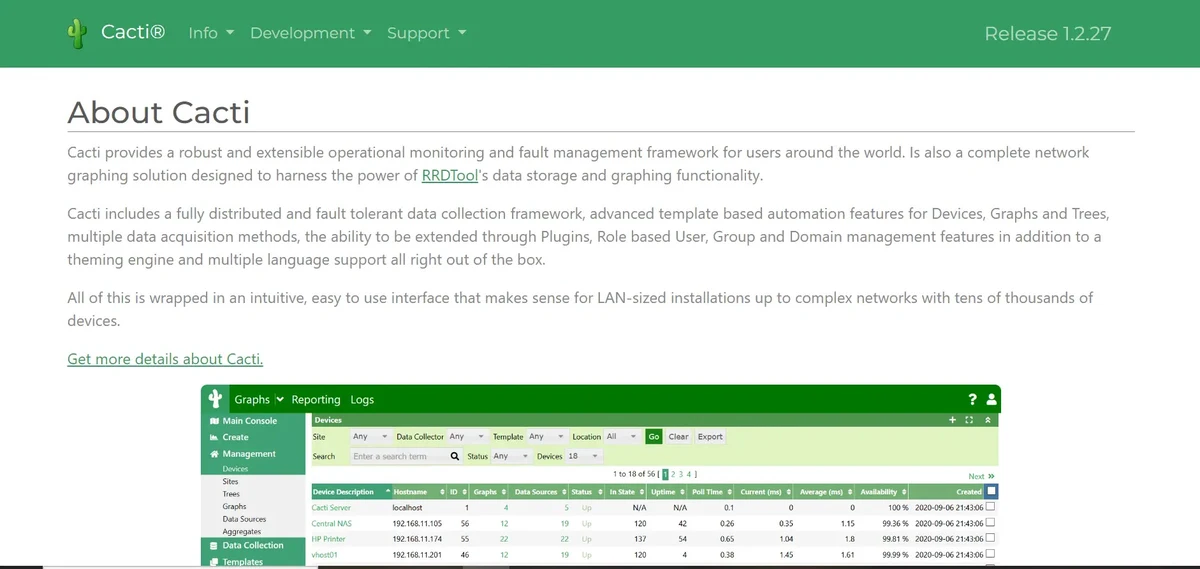
Cacti is an open-source network monitoring and graphing tool designed for visualizing time-series data of network devices. It offers a robust and user-friendly interface for tracking performance metrics.
It leverages the power of RRDTool’s data storage and graphing functionality, allowing users to create custom data sources and graphs for detailed performance monitoring and trend analysis.
Cacti supports a range of templates and plugins, making it highly customizable and extensible for various network monitoring needs, from small home networks to large enterprise environments.
Pros and Cons
| Pros | Cons |
|---|---|
| 1. Open-source and cost-effective. | 1. Can be complex to configure. |
| 2. Highly customizable with various plugins. | 2. Limited real-time alerting features. |
| 3. Comprehensive graphing and visualization capabilities. | 3. Performance can degrade with large datasets. |